


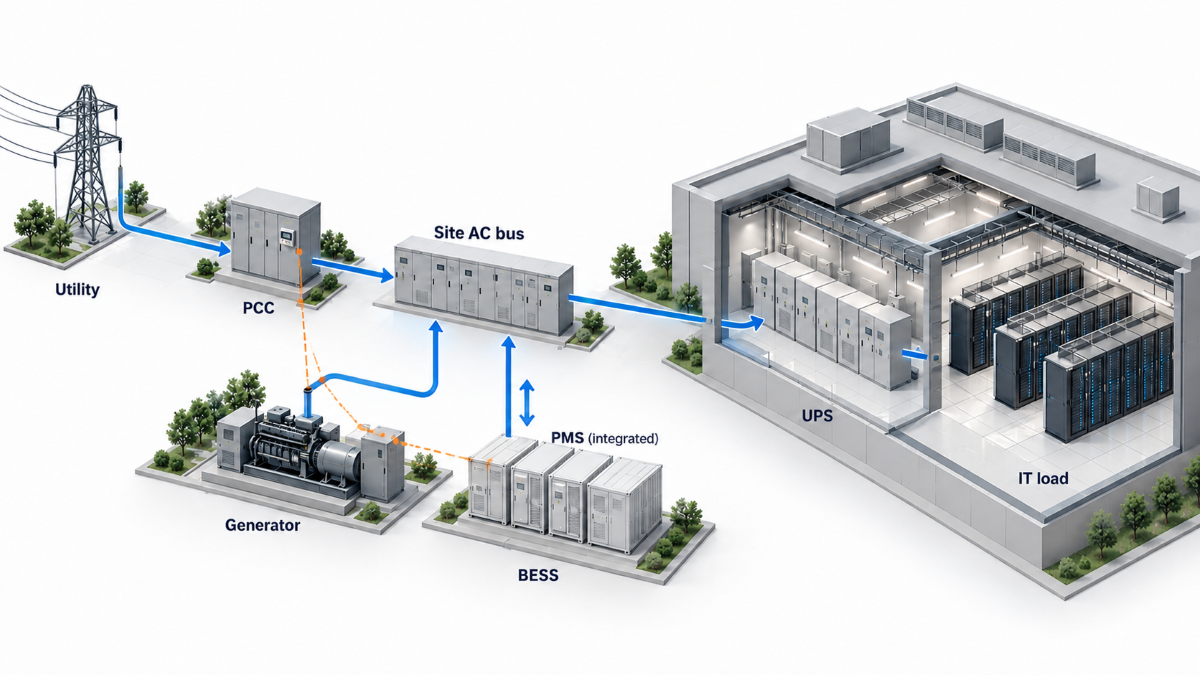
Grid-forming storage for an AI data center is sized from the power behavior that reaches the storage connection and the point of common coupling (PCC). The specification reflects the remaining load swings after rack-level smoothing and UPS operation, grid strength, required operating modes, and the duties other equipment already covers. At DoGo Power, we assess power, energy, control response and state-of-charge (SOC) reserve as separate requirements within a coordinated system. The battery works alongside the UPS, generators and utility; transient studies and annual models answer different questions.
The IEA’s 2026 outlook projects global data center electricity consumption rising from 485 TWh in 2025 to 950 TWh in 2030, with consumption from AI-focused facilities tripling over that period. That growth does not determine a BESS rating; the remaining duty still has to be defined at the storage connection and PCC.
How to Define the AI Load a Grid-Forming BESS Needs to Handle
Measure AI Load at the Storage Connection and PCC
GPU telemetry, UPS input measurements and a PCC meter can show three different “AI loads.” The storage specification follows the behavior at its connection point and the PCC. Across the campus, fluctuations from separate halls may partially offset one another or compound when workloads run in sync. Installed power-smoothing equipment changes that profile further.
NVIDIA’s GB300 NVL72 power-smoothing design combines a power cap, capacitors in the power shelf and controlled ramp-down behavior. When rack-level smoothing and UPS behavior are already represented in a site model, adding raw GPU swings again can count the same fluctuation twice. Measurements at successive connection points help establish what remains for the facility battery to handle.
Time-aligned voltage, current and power records help separate a local equipment event from a campus-wide change. The recording interval needs to resolve the fluctuations under study. Hourly averages can describe energy demand while hiding the steps that determine fast control requirements.
Turn Load Measurements into a Duty Envelope
A duty envelope defines the range of power demands and operating conditions the system will face. It records upward and downward steps, ramp rates, event duration, repetition and recovery time. It also captures synchronized hall operation, active and reactive power, utility limits and grid-connected, generator-supported or islanded operation. These measurements translate “AI load smoothing” into a defined electrical task. NERC’s May 2026 Level 3 alert likewise addresses computational-load modeling, instrumentation, protection and control.
Does the Site Need PCC Power Control Alone, or Grid-Forming Capability as Well?
A volatile load alone does not settle the control question. On a strong grid, maintaining PCC power within agreed limits may be the main task. The choice between grid-forming and grid-following control follows from the site’s voltage and frequency support requirements. Weak grids and generator-supported campuses bring load smoothing and source dynamics together; islanded operation also needs an established voltage and frequency reference and coordinated load sharing.
The same control-mode decision must cover downward steps and reconnection, not only rising load. PJM reported that approximately 3,800 MW of data center load disconnected and transferred to backup generation during a July 22, 2026 disturbance in Virginia. The event produced substantial voltage and frequency swings, illustrating why load loss and subsequent reconnection belong in the duty envelope used to evaluate PCC control, generator response and any grid-forming function.
When Does an AI Data Center Need Grid-Forming Storage?
| Site condition | Grid-following (GFL) | Grid-forming (GFM) |
|---|---|---|
| Strong utility grid, with PCC power control as the main objective | Can follow power commands against an established grid reference. | May be appropriate when the project also requires voltage or frequency support. Load fluctuations alone do not establish a need for GFM. |
| Weak grid with voltage or frequency stability concerns | Relies on an external voltage and frequency reference. | A candidate where the BESS is required to support voltage and frequency or damp system disturbances. |
| Generator-supported operation | Can operate against a stable reference established by the generators. | Relevant when the BESS is assigned a grid-support role or must maintain the reference during changes in generator availability. |
| Islanded operation | Requires another source to establish the islanded grid reference. | Can establish voltage and frequency when the selected system supports the required islanded operating mode. |
| Black-start or staged restoration | Requires an energized source or an established reference. | Can support restoration when black-start capability is included in the system design. |
The choice follows the electrical duty assigned to the BESS. PCC power control addresses the power profile seen by the utility, while grid-forming control addresses voltage and frequency behavior when the system needs a local reference. A project may require both functions, with their interaction defined in the control design.
How to Size BESS Power, Energy and SOC Recovery Separately
Short Load Events Need High Power but Little Energy
Megawatts and megawatt-hours answer different questions. Consider an illustrative event in which the battery supplies an additional 5 MW for 10 seconds after the contributions of other resources have been accounted for:
5 MW × 10 s ÷ 3,600 s/h ≈ 0.0139 MWh, or 13.9 kWh
Sustaining the same 5 MW for 15 minutes requires 1.25 MWh. The power requirement stays unchanged while the energy requirement grows ninetyfold. These are ideal energy calculations. Conversion losses, usable SOC range, equipment limits, reserve, aging and temperature enter the actual sizing calculation. Even the shorter event requires equipment capable of delivering the full 5 MW.
Repeated Load Swings Require Discharge Reserve and Charging Headroom
Repeated events create two separate power requirements. When demand rises, the BESS discharges so the full upward step does not pass to the PCC. When demand falls, it charges so the downward step does not pass directly to the grid or a generator-supported bus. Sizing therefore tracks charge and discharge power, event spacing and SOC movement while preserving energy for islanding, generator-start support or backup.
Discharge reserve alone is insufficient. A battery near its upper SOC limit has little charging headroom for a sudden load reduction; one near its lower limit may be unable to support the next upward step. Temperature, SOC and state of health further constrain available power, with the battery management system enforcing the operating limits.
On a generator-supported campus, storage can absorb the difference while generation ramps down after a load drop. Repeated events may push SOC toward either limit before the generator settles. The recovery schedule must return the battery to its target SOC band before the next event.
Turn the Duty Envelope into an RFQ Specification
The sizing study converts the duty envelope into RFQ values that suppliers can quote against. The AC power requirement specifies charge and discharge levels, step sizes, ramp rates, event duration and repetition. Usable energy covers the event sequence, backup duty and reserved SOC window. The recovery requirement defines how quickly the target SOC band must be restored without creating another PCC peak.
Those values apply to the complete electrical path, not only the battery container. A comparable offer identifies battery limits, PCS rating, transformer, connection voltage and connection equipment, together with the conditions for the quoted AC power and usable energy. Container kWh and a stated C-rate alone do not establish power delivered to the campus, so offers that omit the complete path are not directly comparable.
How a Grid-Forming BESS Works with UPS, Generators and the Grid
Which Layer Handles Which Fluctuation
Each layer between the GPU and the grid has a distinct responsibility. Their combined behavior determines the load presented upstream.
| System layer | Primary responsibility |
|---|---|
| Rack battery backup units, capacitors or supercapacitors | Buffer equipment-level fluctuations within their designed operating range. |
| UPS and its DC link | Maintain conditioned, uninterrupted power to the critical IT bus. |
| Facility-level BESS | Manage site power flow and provide the specified voltage, frequency and operating-mode support. |
| Utility and onsite generators | Supply sustained energy and replenish longer-duration reserves. |
Vertiv’s comparison of UPS and BESS architectures distinguishes critical-load protection from site-level energy management. In a parallel behind-the-meter layout, the BESS exchanges power with the site AC bus while the UPS protects the IT supply path. This arrangement gives each system a defined role during both routine fluctuations and supply disturbances.
Control Responsibilities Across PCS, PMS, BMS and EMS
Within our 4S grid-forming architecture, converter response, power coordination, battery protection and energy scheduling share one control framework. The PCS handles bidirectional conversion and grid-forming behavior. The power management system (PMS) coordinates storage with generators, PV and the grid. The battery management system (BMS) monitors battery conditions and operating limits, while the energy management system (EMS) handles forecasting, scheduling and longer-term energy allocation.
At the grid connection, our PMS supports PCC power control and anti-reverse-flow control. Direct PT/CT inputs provide grid measurements without a separate meter in that control path. This connects plant-level power targets to measurements at the point where the utility sees the campus.
Keep Fast Control Local and Define the Handoffs
The three-layer grid-forming control architecture separates device-level response from coordination and economic dispatch. The millisecond layer covers inertia response and primary voltage and frequency control. A coordination layer operates at around 100 ms for secondary regulation and operating-mode coordination, while minute-level dispatch handles economic operation. These are distinct control timescales rather than one response-time figure for the entire site.
Because fast control must remain available without cloud dependence, the control sequence defines SOC recovery, generator handover, grid reconnection and behavior during communication or measurement loss. The EMS supports private local and public-cloud deployment, while local fallback settings and controller responsibilities are established in the site’s electrical design. A response target covers the measurement, communication and converter path together. Time-stamped records of commands and actual power reveal whether the complete loop reaches the required response, rather than treating the speed of one controller as the speed of the system.
Choosing a BESS Configuration for a Phased AI Campus
Comparing Integrated and Modular Storage Against the Duty Envelope
Required AC power, usable energy, connection voltage, space and redundancy turn the duty envelope into a product comparison. Two configurations in our range offer different starting points for that assessment:
| Candidate configuration | Relevant design features | Main selection question |
|---|---|---|
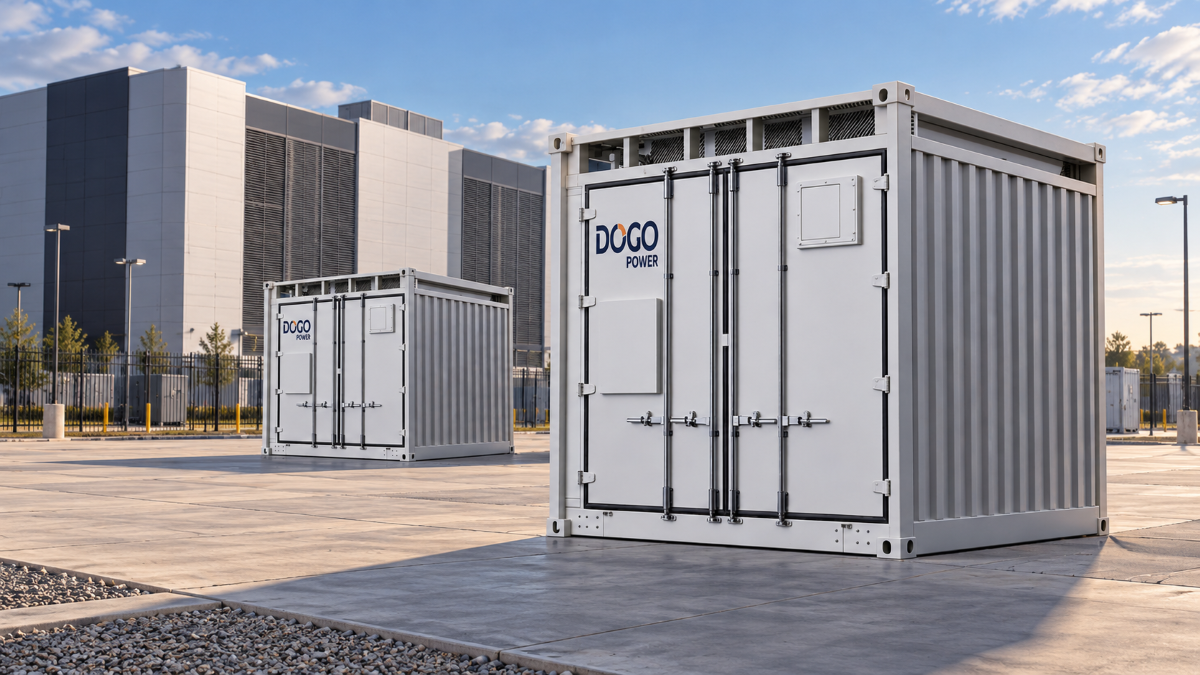
| DG1000-1672kWh integrated BESS | 1,672 kWh; an all-in-one 10-foot container integrating LFP batteries, liquid-cooled PCS, BMS, thermal management and fire suppression. | How does the integrated unit fit the site connection, installation plan and operating modes? |
| DG2000 modular grid-forming BESS | 1,672, 2,090 or 2,508 kWh configurations; 10-foot format, factory-pre-integrated PCS and quick-plug inter-unit power connections; maximum charge/discharge rate of 0.5 CP for the 2H0 series. | Which battery configuration and PCS arrangement match the required AC power, operating duration, redundancy and site connection? |
For either candidate, the project AC power rating is confirmed from the selected PCS, transformer, connection voltage and approved system configuration; the published kWh rating alone does not establish facility output.
The DG2000 offers different power-to-energy configurations for projects with different operating durations. The 2H0 series lists a maximum charge/discharge rate of 0.5 CP, while the 2508 kWh 4H0/4H1 configuration is listed at 0.25 CP. Combined with the standard 10-foot format, factory-pre-integrated PCS and quick-plug inter-unit power connections, these options provide a basis for evaluating AI load smoothing, backup reserve and phased campus expansion. The final AC power rating depends on the selected battery configuration, PCS arrangement and electrical connection capacity.
The DG1000-1672kWh combines the battery, conversion, cooling and protection systems in one enclosure. Up to two units can be connected in one configuration, providing a total rated capacity of 3,344 kWh. Its integration can simplify equipment coordination; the site layout still determines transformer placement, electrical connections and service access. Comparing complete layouts makes those installation differences visible.
Energy Expansion vs Power Expansion in a BESS
Additional battery capacity extends the energy available at a given output. Higher AC power involves the PCS, transformer, busbars and switchgear as well as the battery. A phased campus plan therefore identifies which requirement grows when another hall comes online.
That distinction also affects redundancy. An unavailable unit reduces the remaining power and energy, potentially changing both load-buffering capability and backup duration. The expansion plan captures these reduced-capacity operating states, together with space, connection provisions and controls for the next stage.
Each construction phase has its own load profile. Another hall can raise sustained demand and enlarge synchronized load swings. Comparing the initial build and later stages against the same event definitions shows when additional energy is enough and when conversion or connection capacity also needs to grow.
How to Reserve BESS Capacity Before Commercial Dispatch
Reserve Capacity for Each Operating Duty
A facility battery can take on several jobs, each drawing on the same power and energy. AI load buffering, islanding reserve, generator-start support, SOC recovery, demand management and energy arbitrage compete for that capability. Reliability duties establish the reserve allocation; the remaining capacity sets the scope for commercial dispatch.
Crediting the same megawatt to several simultaneous services overstates returns. A load event that coincides with market dispatch exposes that overlap immediately. The operating schedule therefore links service priorities to available charging and discharging power, usable energy and the time needed to restore reserve.
A like-for-like commercial comparison holds the required supply duty constant across configurations. It includes the cost of reserve, battery replenishment, replacement and operation over the project life. A lower initial equipment price can lose its advantage when the proposed schedule leaves less usable capacity or requires earlier replacement.
What an 8760-Hour Sizing Model Can and Cannot Show
The EcoSizing 8760-hour sizing model answers planning questions that depend on chronology: whether the selected energy capacity can cover daily and seasonal event sequences, whether the target SOC reserve can be restored before the next modeled event, and how tariffs change dispatch. It uses mixed-integer linear programming across a full chronological year at time steps from one hour down to 15 minutes.
The model can compare product quantities, capacity mixes, charging windows and the cost of holding SOC in reserve. Year-by-year cash flow incorporates depth of discharge, discharge rate, cycle life and calendar life, together with replenishment and replacement. If the required events and SOC recovery constraints are explicitly represented, the model can identify configurations that cannot restore the specified reserve before the next modeled event, even when nameplate energy capacity appears sufficient. A brief power spike may also leave billed demand unchanged when it is shorter than the tariff’s billing interval.
The model cannot establish subsecond electrical behavior. Hourly or 15-minute steps do not prove millisecond response, UPS interaction, PCS current limiting, voltage and frequency recovery or fault ride-through. Those questions require electromechanical transient or EMT studies, HIL testing and factory/site tests. The annual model screens energy-and-reserve plans; dynamic studies determine whether the controls and electrical path can deliver them.
How to Validate Grid-Forming Storage for an AI Data Center
Build a Validation Test Matrix
The measured duty envelope defines the events to test and the evidence to record. A proposed matrix connects each operating condition to a result the design team can assess:
| Proposed event | Evidence to request |
|---|---|
| Repeated upward and downward load changes | PCC power traces, residual ramp rates, response time, settling and SOC recovery. |
| Grid loss and planned islanding | Voltage, frequency, UPS input and generator response. |
| Generator start, synchronization and handover | Load sharing and the transfer sequence. |
| PCS current limiting | Active/reactive power priority, protection behavior and recovery. |
| Low SOC or temperature-limited operation | Available power and duration under the stated conditions. |
| One storage unit unavailable | Remaining capability and control stability. |
| Communication or measurement loss | Local fallback behavior and alarm records. |
| Grid reconnection | Synchronization, ramp rates and any secondary power disturbance. |
Match Each Simulation Model to Its Timescale
Electromagnetic transient (EMT) simulation examines converter, protection and fast dynamic behavior. Hardware-in-the-loop (HIL) testing connects real controllers to a simulated plant. Full-year modeling covers energy and economics, while factory and site tests assess the assembled system. Through our C&I simulation services, electromechanical transient, EMT and HIL studies are available for evaluating system behavior.
Dynamic-study results also depend on the load model. ERCOT and Texas A&M University’s large-load modeling work includes an AI data center PSCAD model released in 2026. It represents generic plant behavior, providing a starting point for analysis rather than a representation of a specific campus. Site measurements and equipment settings connect that framework to the actual project.
Product Qualification vs Site-Level Validation
NVIDIA launched DSX Ready in September 2026, initially covering BESS and cooling distribution units. The program distinguishes equipment qualification from site engineering and stability. Product test results apply to the project only when their hardware, controls and operating conditions match the proposed installation.
Evidence from another load class cannot substitute for AI data center validation. The applicable test events must come from the campus load profile, UPS behavior and generator controls.
The RFQ evidence package ties these studies to selected hardware, firmware, control settings and model assumptions. It also records operating sequences, protection coordination, UPS and generator interfaces, test conditions and acceptance limits. Responsibility for retesting after a configuration change keeps that evidence connected to the delivered system.
The clearest validation record is a time-aligned trace of the load event, control action and resulting PCC behavior. It lets the owner see how much disturbance remains, what reserve was used and how the system recovered.
FAQs
Does a sub-20 ms transfer time guarantee uninterrupted IT power?
A transfer-time specification describes a defined switching event. IT continuity involves the complete supply path through the UPS to the load, including its behavior during the transition. Integrated testing establishes that performance.
Will adding battery capacity increase the system’s power rating?
Energy capacity and AC power have separate limits. A power increase requires adequate battery output and conversion, transformer and connection capacity; adding batteries alone does not establish the new rating.
Can the same BESS smooth AI loads and reduce demand charges?
Both duties can share a system when the schedule preserves their required power, energy and SOC margins. The available savings follow the remaining dispatch capability and the site’s tariff.
Start With the Power Behavior at the PCC
The specification connects measured load behavior to power, energy, recovery and control requirements. Product selection and simulation then address the same operating conditions, so the campus can compare configurations and plan expansion against a common duty.
For an initial configuration discussion, contact the engineering team with the measured PCC load profile, single-line diagram and required operating modes. These inputs support an initial duty-to-configuration assessment and identify the additional data required for detailed simulation. UPS, generator, utility-limit and expansion details can follow during the detailed study.


